
RISE Performance Metrics: 4 Steps to Prove Them with Metric-by-Metric Badge Mapping

The 4-step practice of mapping the 6 core RISE performance metrics to metric-specific badges, organized in comparison with qualitative reports.
Why Map RISE Performance Metrics to Badges?
When you map RISE performance metrics to digital badges, institution-level outcomes such as employment rates or regional settlement are decomposed into a single student’s activity data and become verifiable. The 2026 Anchor (regional-growth talent development system) framework evaluates 2025 outcomes and allocates about KRW 400 billion in budget differentially, so universities that have left their metrics as badges can submit outcomes as student-level quantitative evidence instead of qualitative reports.
Performance metrics usually exist as “result numbers.” A certain employment-rate percentage, a certain number of industry-academic projects. The problem is that the student activity behind those numbers is not left as data.
The weight is already there. The 2025 RISE budget was set at about KRW 2 trillion (Ministry of Education, 2025), and in the 2026 Anchor reorganization the Ministry of Education began its first performance evaluation covering 17 cities and provinces, allocating about KRW 400 billion differentially according to outcomes (Electronic Times, 2026). The heavier the evaluation weighs, the more urgent it becomes to leave the activity behind the numbers as data. Badges bridge that gap. If you have designed RISE performance management as a 3-tier structure, this article covers how to attach badges metric by metric within it.
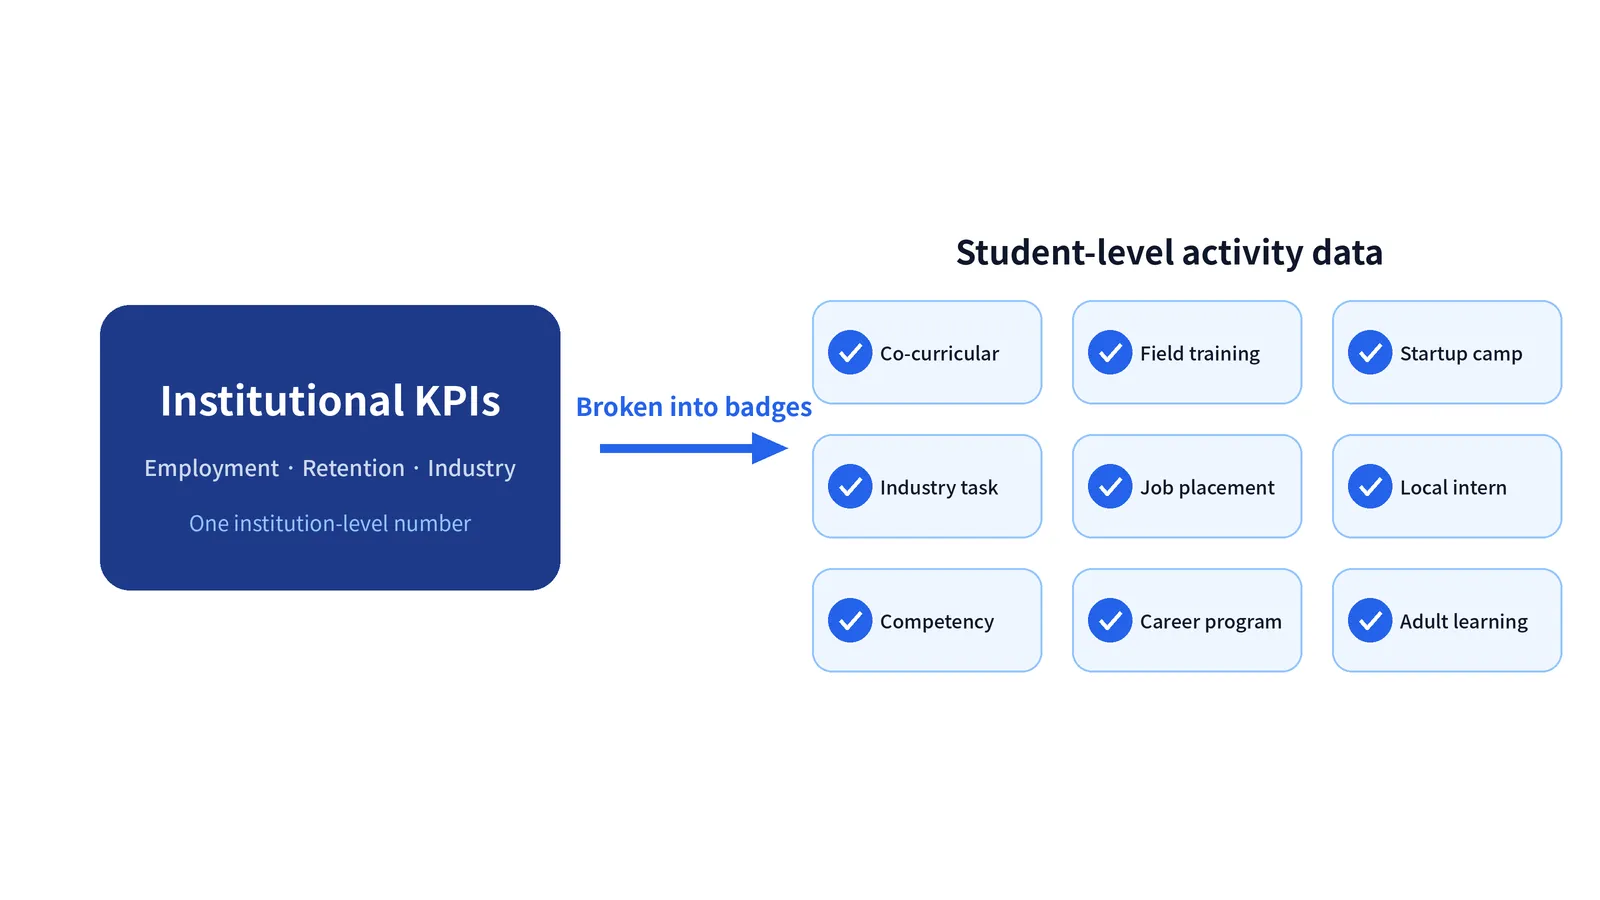
Which Badges Do the Main RISE Performance Metrics Map To?
RISE performance metrics are divided into employment, regional settlement, industry-academic cooperation, extracurricular activities, lifelong education, and entrepreneurship. Each metric differs in badge type, issuance criteria, and aggregated data. Rather than designing new badges for each metric, if you use activity-level unit badges in common and distinguish metrics at the pathway (course) and comprehensive certification (outcome) tiers, one infrastructure can hold every metric.
| Performance metric | Badge type | Issuance criteria | Aggregated data |
|---|---|---|---|
| Employment/career | Employment competency comprehensive certification | Career program completion + competency achievement | Employment linkage rate |
| Regional settlement | Regional linkage activity badge | Participation in regional industry-academic programs/internships | Regional employment and settlement |
| Industry-academic cooperation | Industry-academic project pathway | Completion of a company-linked assignment | Number of industry-academic results |
| Extracurricular competency | Unit competency badge | Participation and achievement in extracurricular activities | Participation counts and completion rate |
| Lifelong/adult learning | Lifelong education completion badge | Course completion | Adult learner re-enrollment |
| Entrepreneurship | Startup camp unit badge | Completion of entrepreneurship education/camp | Startup participation and outcomes |
The “aggregated data” column on the right of the table is the key. Employment/career remains as “employment linkage rate,” extracurricular competency as “participation counts and completion rate,” and lifelong/adult learning as “adult learner re-enrollment.” These values accumulate automatically the moment a badge is issued, so there is no need to gather evidence anew at performance-reporting time.
How Do You Turn Metrics into Badges?
Mapping proceeds in four steps: metric selection, issuance criteria definition, data integration, and aggregation/reporting. The most important is the second step. If you fix each metric’s “achievement” as a measurable condition, such as “participate in extracurricular activities 3 times,” issuance and aggregation flow automatically afterward. If the criteria are vague, you cannot use badges as performance data no matter how many you issue.
If you attach program tags to the badges as well, you can aggregate RISE, Glocal University 30, and LINC 3.0 outcomes separately on a single infrastructure.
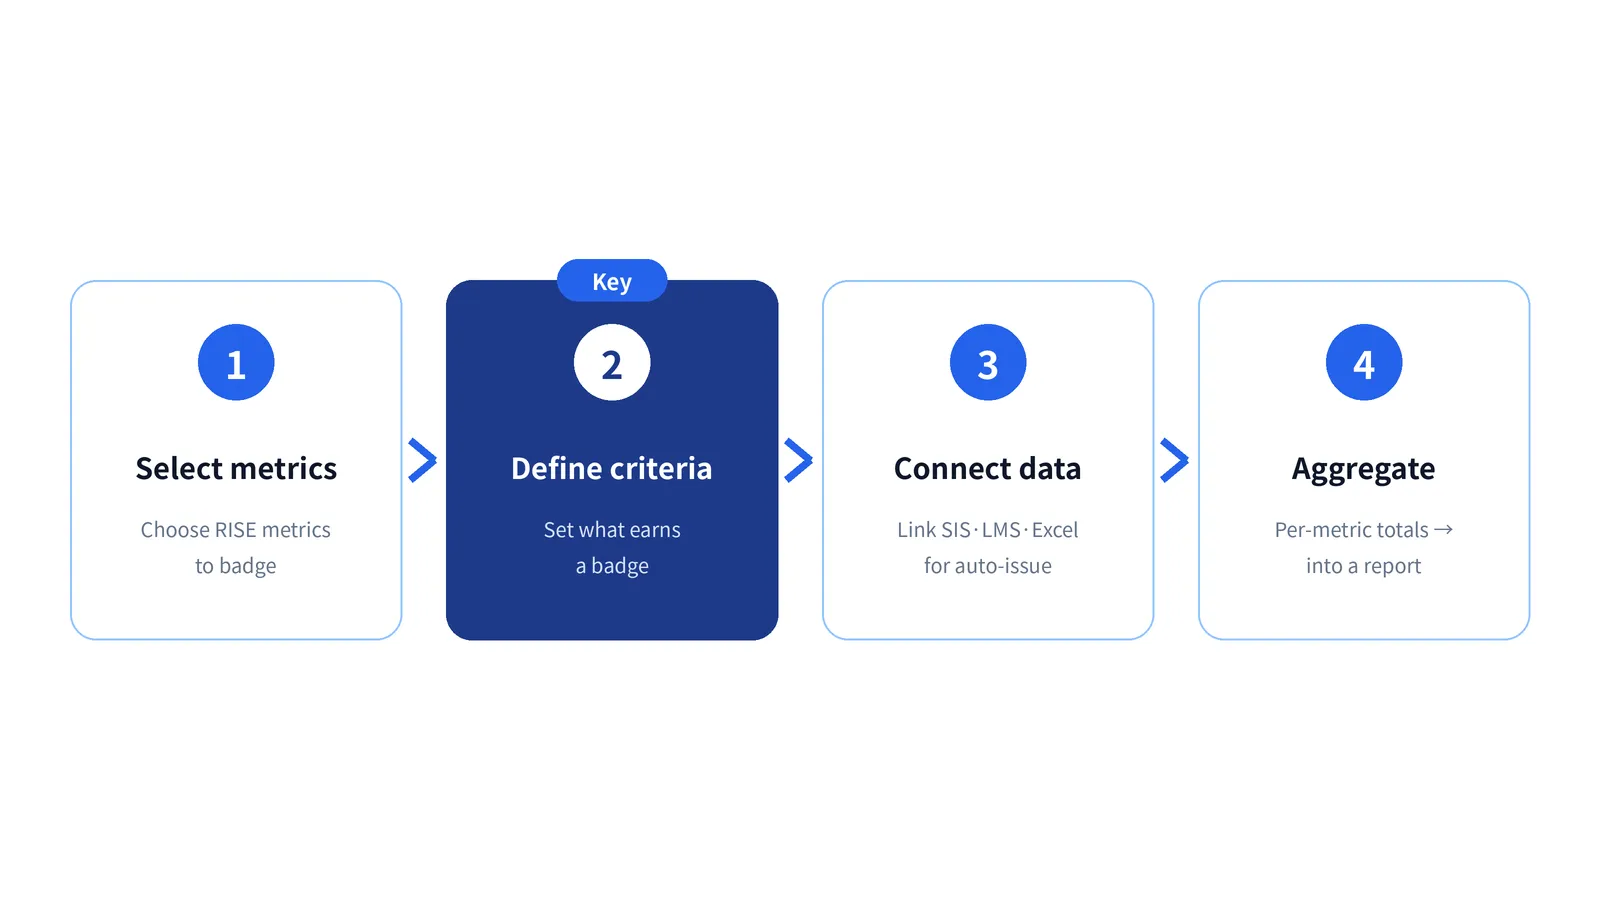
How Do You Prove Outcomes with Issuance Data?
Issued badges convert directly into aggregate tables by metric and become supporting evidence. Since the Anchor performance evaluation divides grades by 40% quantitative and 60% qualitative, participation counts, completion rates, acquired competencies, and employment-linkage values become quantitative evidence as they are once they remain at the student level. Because verification information is included and an evaluator can confirm authenticity immediately, this is the decisive difference from scattered records or qualitative reports.
| Category | Qualitative report | Digital badge data |
|---|---|---|
| Unit of evidence | Institution-level narrative | Student-level quantitative data |
| Authenticity verification | Evaluator checks separately | Verification information embedded, confirmed instantly |
| Data aggregation | Manually compiled at reporting time | Automatically accumulated upon issuance |
| Distinguishing by program | Reclassified every time | Re-aggregated by program tag |
| Repetitive work | Written anew for each evaluation | Reusable once accumulated |
The rows where it diverges from qualitative reports are “authenticity verification” and “data aggregation.” Verification information is embedded so an evaluator confirms it instantly, and data accumulates the moment a badge is issued. Anchor’s first performance evaluation divided grades by city and province with a 40% quantitative and 60% qualitative weighting (Electronic Times, 2026). It means that how densely you left quantitative evidence at the student level leads directly to your grade.
There are actual examples. How to leave extracurricular outcomes as verifiable evidence shows the flow in which participation counts and completion rates are aggregated, and the 3-tier structure case of the University of Seoul’s Industry-Academic Cooperation Foundation shows the same flow applied to industry-academic metrics. Once the flow in which activities become badges and badges become metric-by-metric data takes hold, performance reporting becomes a matter of “pulling” data.
Metrics become data not the moment you set them as targets, but from the moment you issue badges.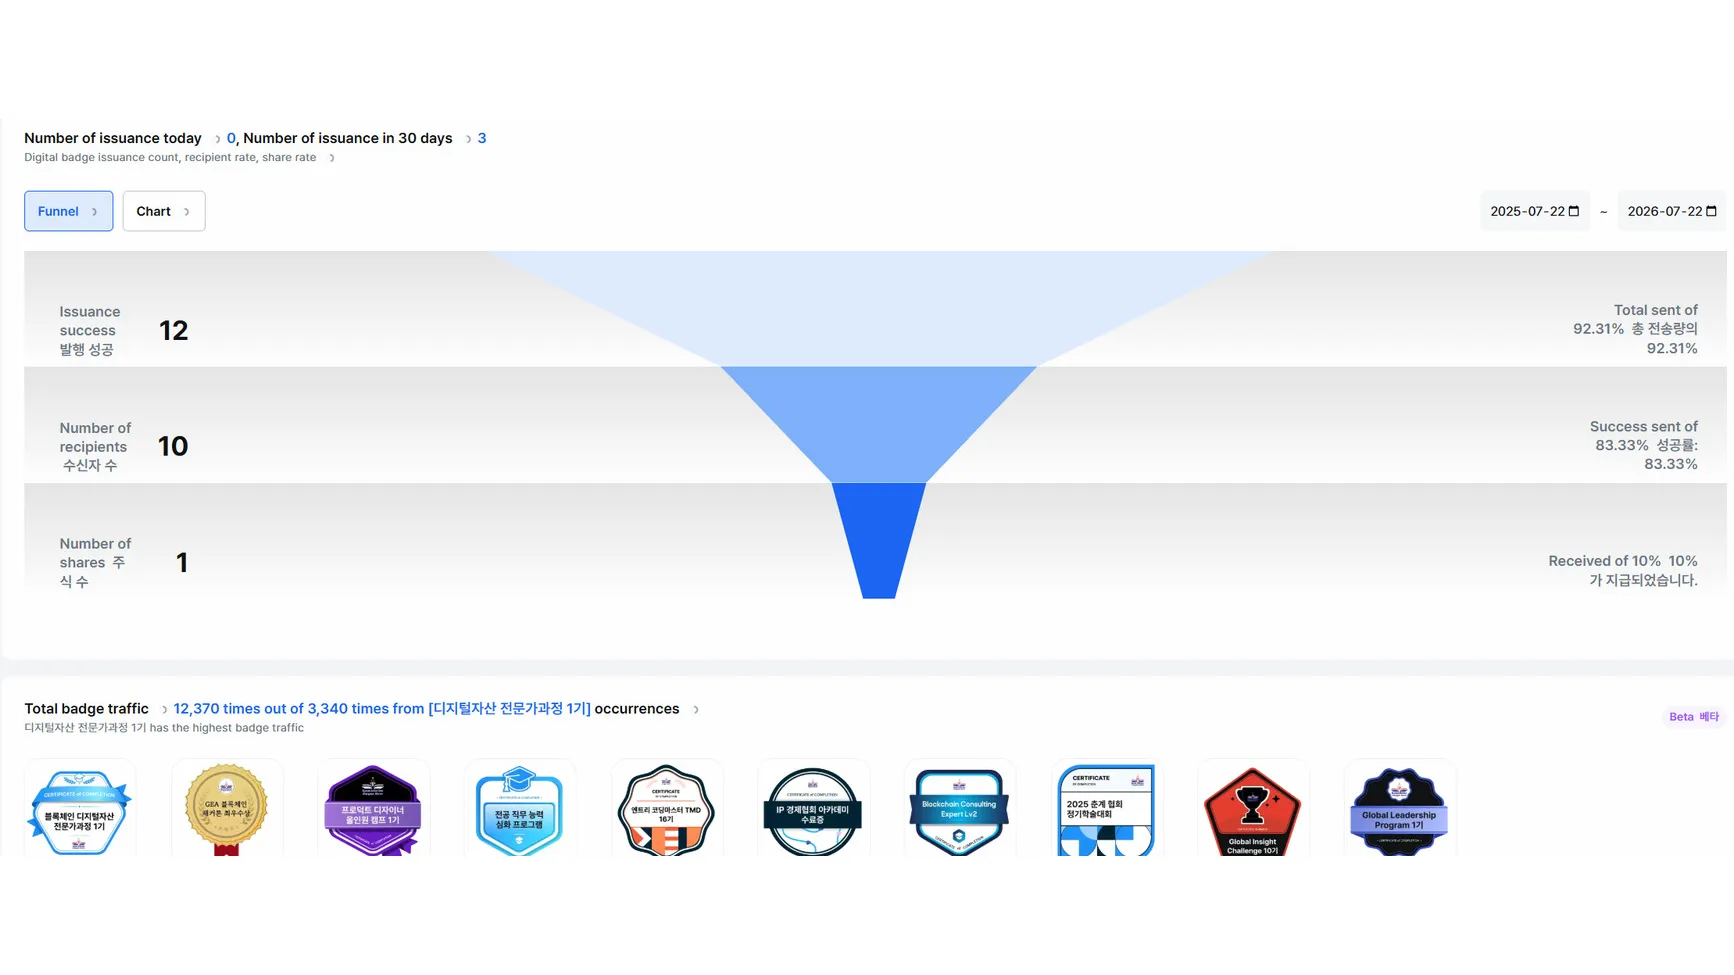
Performance evaluations come around every year, but you do not have to gather supporting evidence anew each time. Kolleges handles everything from metric-by-metric badge issuance to aggregation and reporting output on a single infrastructure. If you are reviewing your RISE response, check the metric-by-metric aggregation screen in the demo.
Frequently asked questions
Want to turn learning outcomes into verifiable assets?
From issuing to verifying and amplifying, see it for yourself with Kolleges.
Request a Kolleges demoRelated posts

2026 RISE·Anchor Performance Evaluation: 3 Steps to Prove University Outcomes with Data
As RISE becomes Anchor, budgets are divided by performance evaluation. Here is how to prove scattered university outcomes with the 3-tier digital badge structure and co-issuance, with cases.

How to Connect RISE Performance with a Three-Tier Digital Badge Structure: A University of Seoul Case
The University of Seoul's RISE project team bundled the outcomes of 7 programs across 3 areas (industry-academia cooperation, AI, and convergence regional innovation) into 15 digital badges. This is the design behind a three-tier structure connecting unit badges through pathways to a comprehensive certification, turning scattered university achievements into verifiable one-line credentials.

How to Write a RISE Performance Report: Building Quantitative Evidence from Badge Data
A 3-step method for building the quantitative evidence in a RISE performance report from digital badge data.