
How to Write a RISE Performance Report: Building Quantitative Evidence from Badge Data

A 3-step method for building the quantitative evidence in a RISE performance report from digital badge data.
What Has Changed About the RISE Performance Report?
The RISE performance report is now a contest of evidence, not narrative. The Anchor (regional-growth talent development system) performance evaluation divides grades by 40% quantitative and 60% qualitative, and allocates about KRW 400 billion in budget differentially across 17 cities and provinces (Electronic Times, 2026). Even with the same activities, the evaluation diverges depending on how densely you submit student-level quantitative evidence.
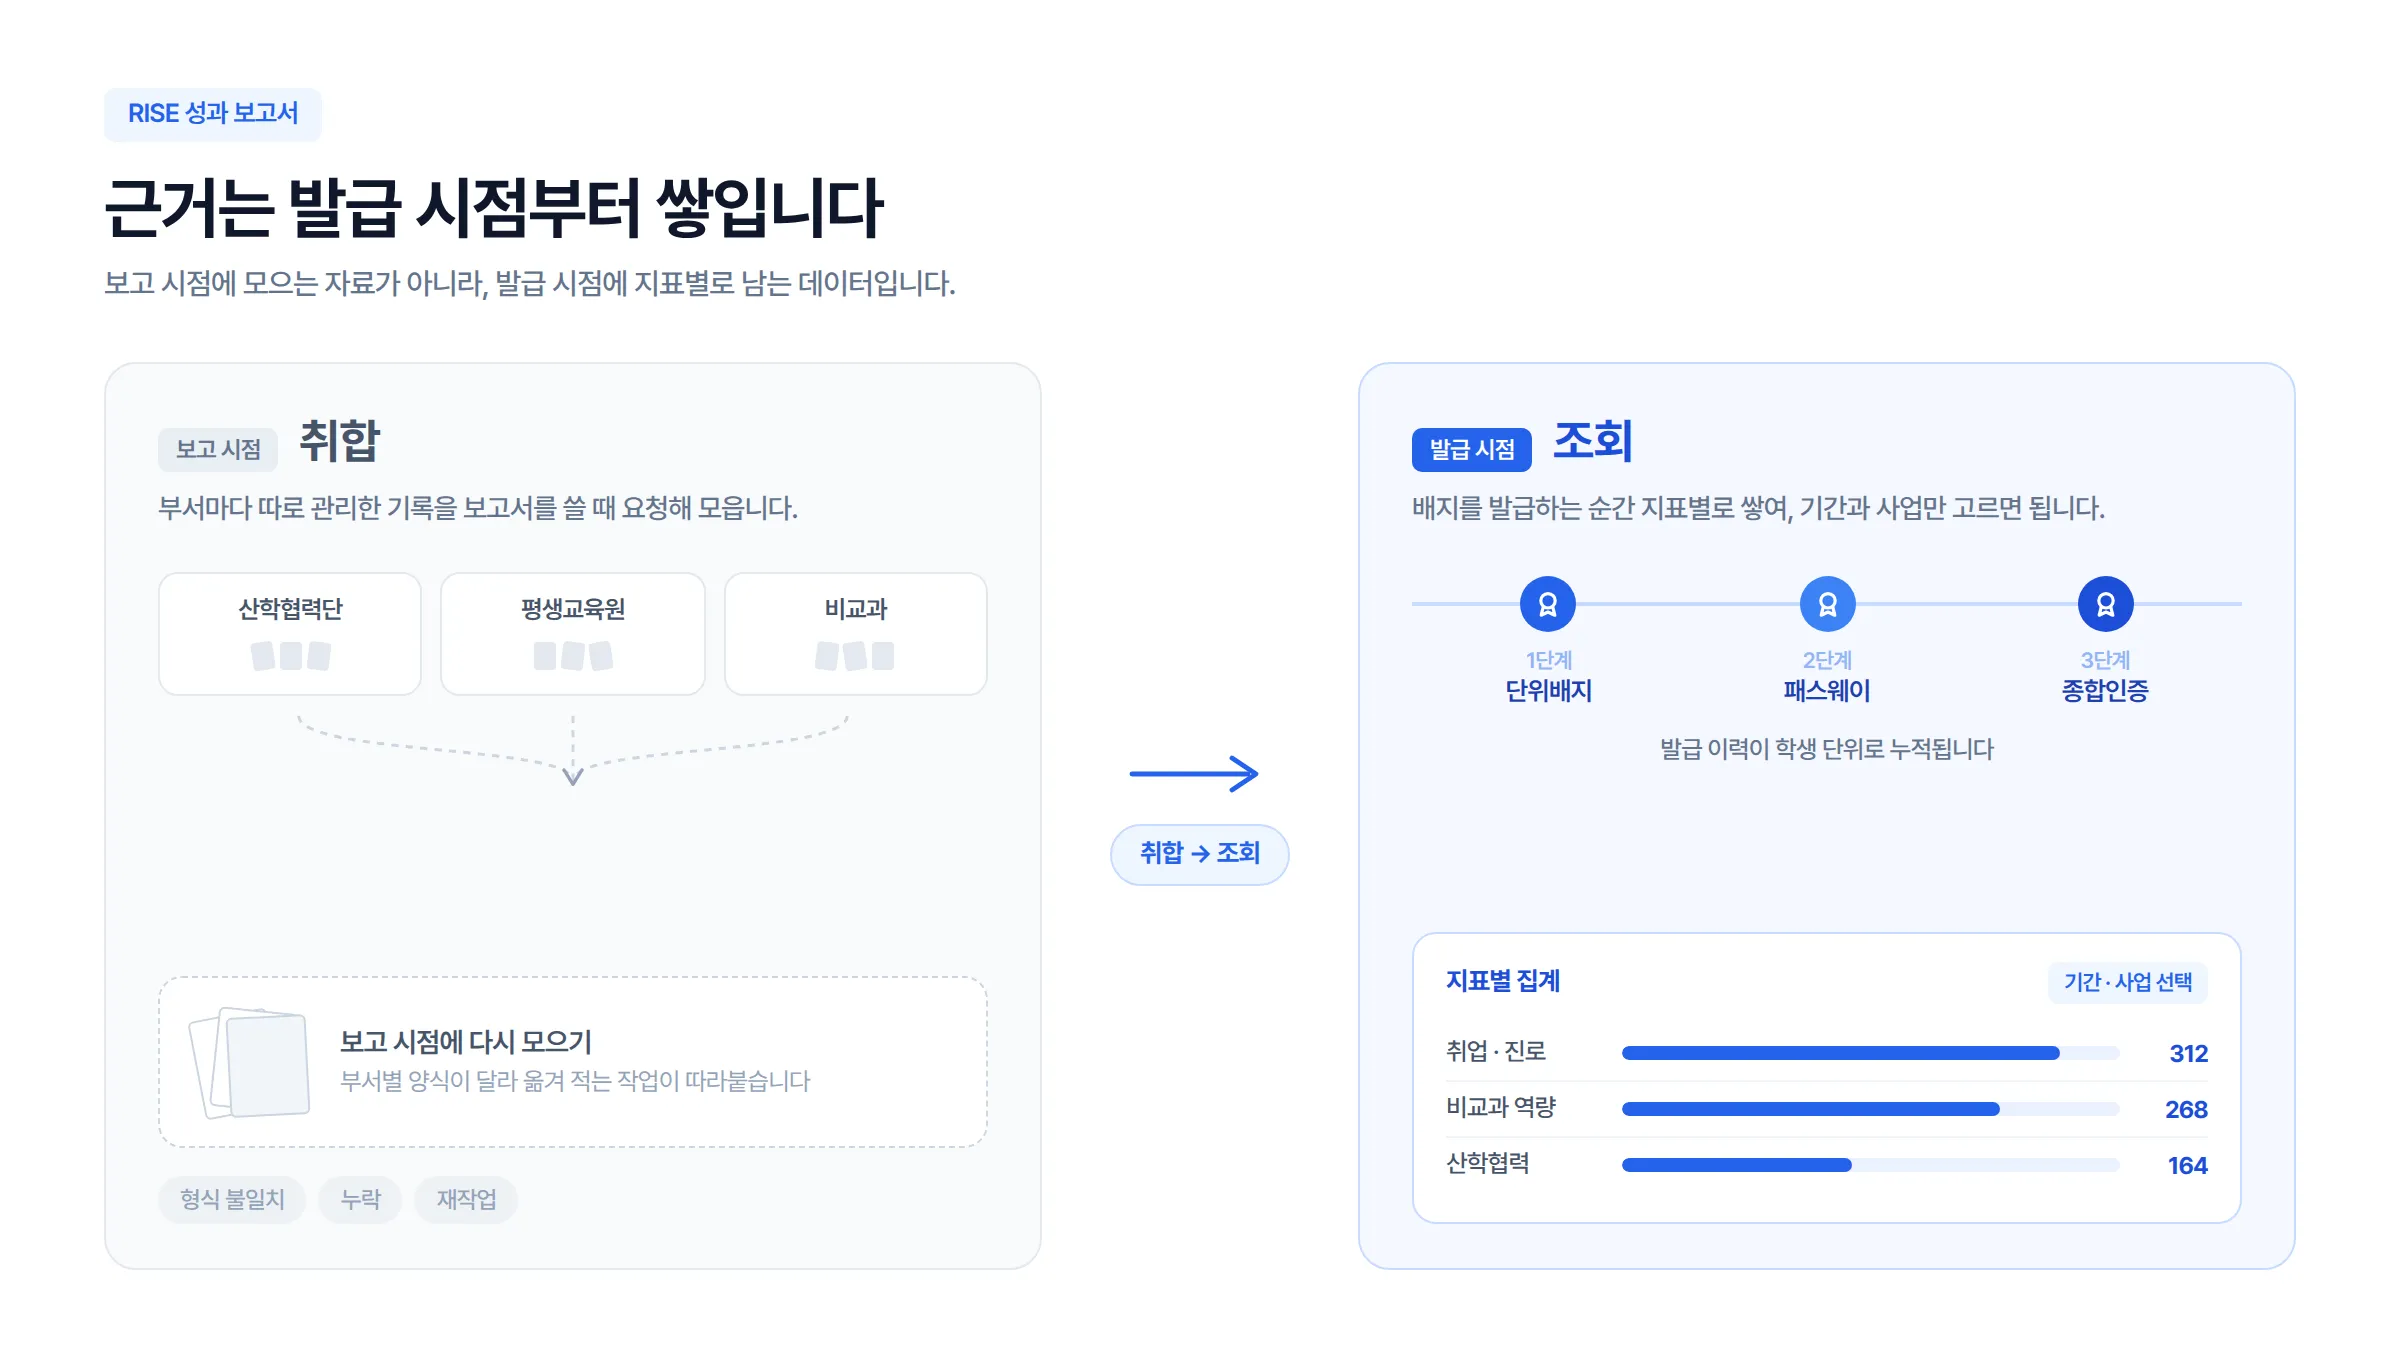
The problem is that report writing mostly gets stuck at “compilation.” When you gather the records that the Industry-Academic Cooperation Foundation, the lifelong education institute, and extracurricular departments each manage separately at reporting time, formats vary, omissions occur, and time disappears.
Changing the order changes things. If you have designed a performance management system as a 3-tier structure and mapped badges by metric, data accumulates by metric from the moment of issuance. This article covers the next step: how to turn accumulated data into a report.
What Quantitative Evidence Goes into the Performance Report?
The report’s quantitative sections come from aggregated data by metric. Once you map badges to metrics, the issuance records themselves become reporting items. Which values remain for which metric is the skeleton of the report.
| Performance metric | Quantitative evidence in the report | Source of the evidence |
|---|---|---|
| Employment/career | Career program completion rate, employment linkage rate | Employment competency comprehensive certification records |
| Industry-academic cooperation | Number of completed company-linked assignments | Industry-academic project pathway |
| Extracurricular competency | Participation counts, completion rate, distribution by competency | Unit competency badge |
| Lifelong/adult learning | Course completion, re-enrollment rate | Lifelong education completion badge |
| Entrepreneurship | Entrepreneurship education completion, follow-up participation | Startup camp unit badge |
The “quantitative evidence in the report” column of the table becomes the report’s table of contents as-is. The employment/career section gets completion rate and employment linkage rate; the extracurricular section gets participation counts and distribution by competency. Because the source of the evidence is entirely issuance records, a student-level record follows every figure.
How Do You Write the Report with Badge Data?
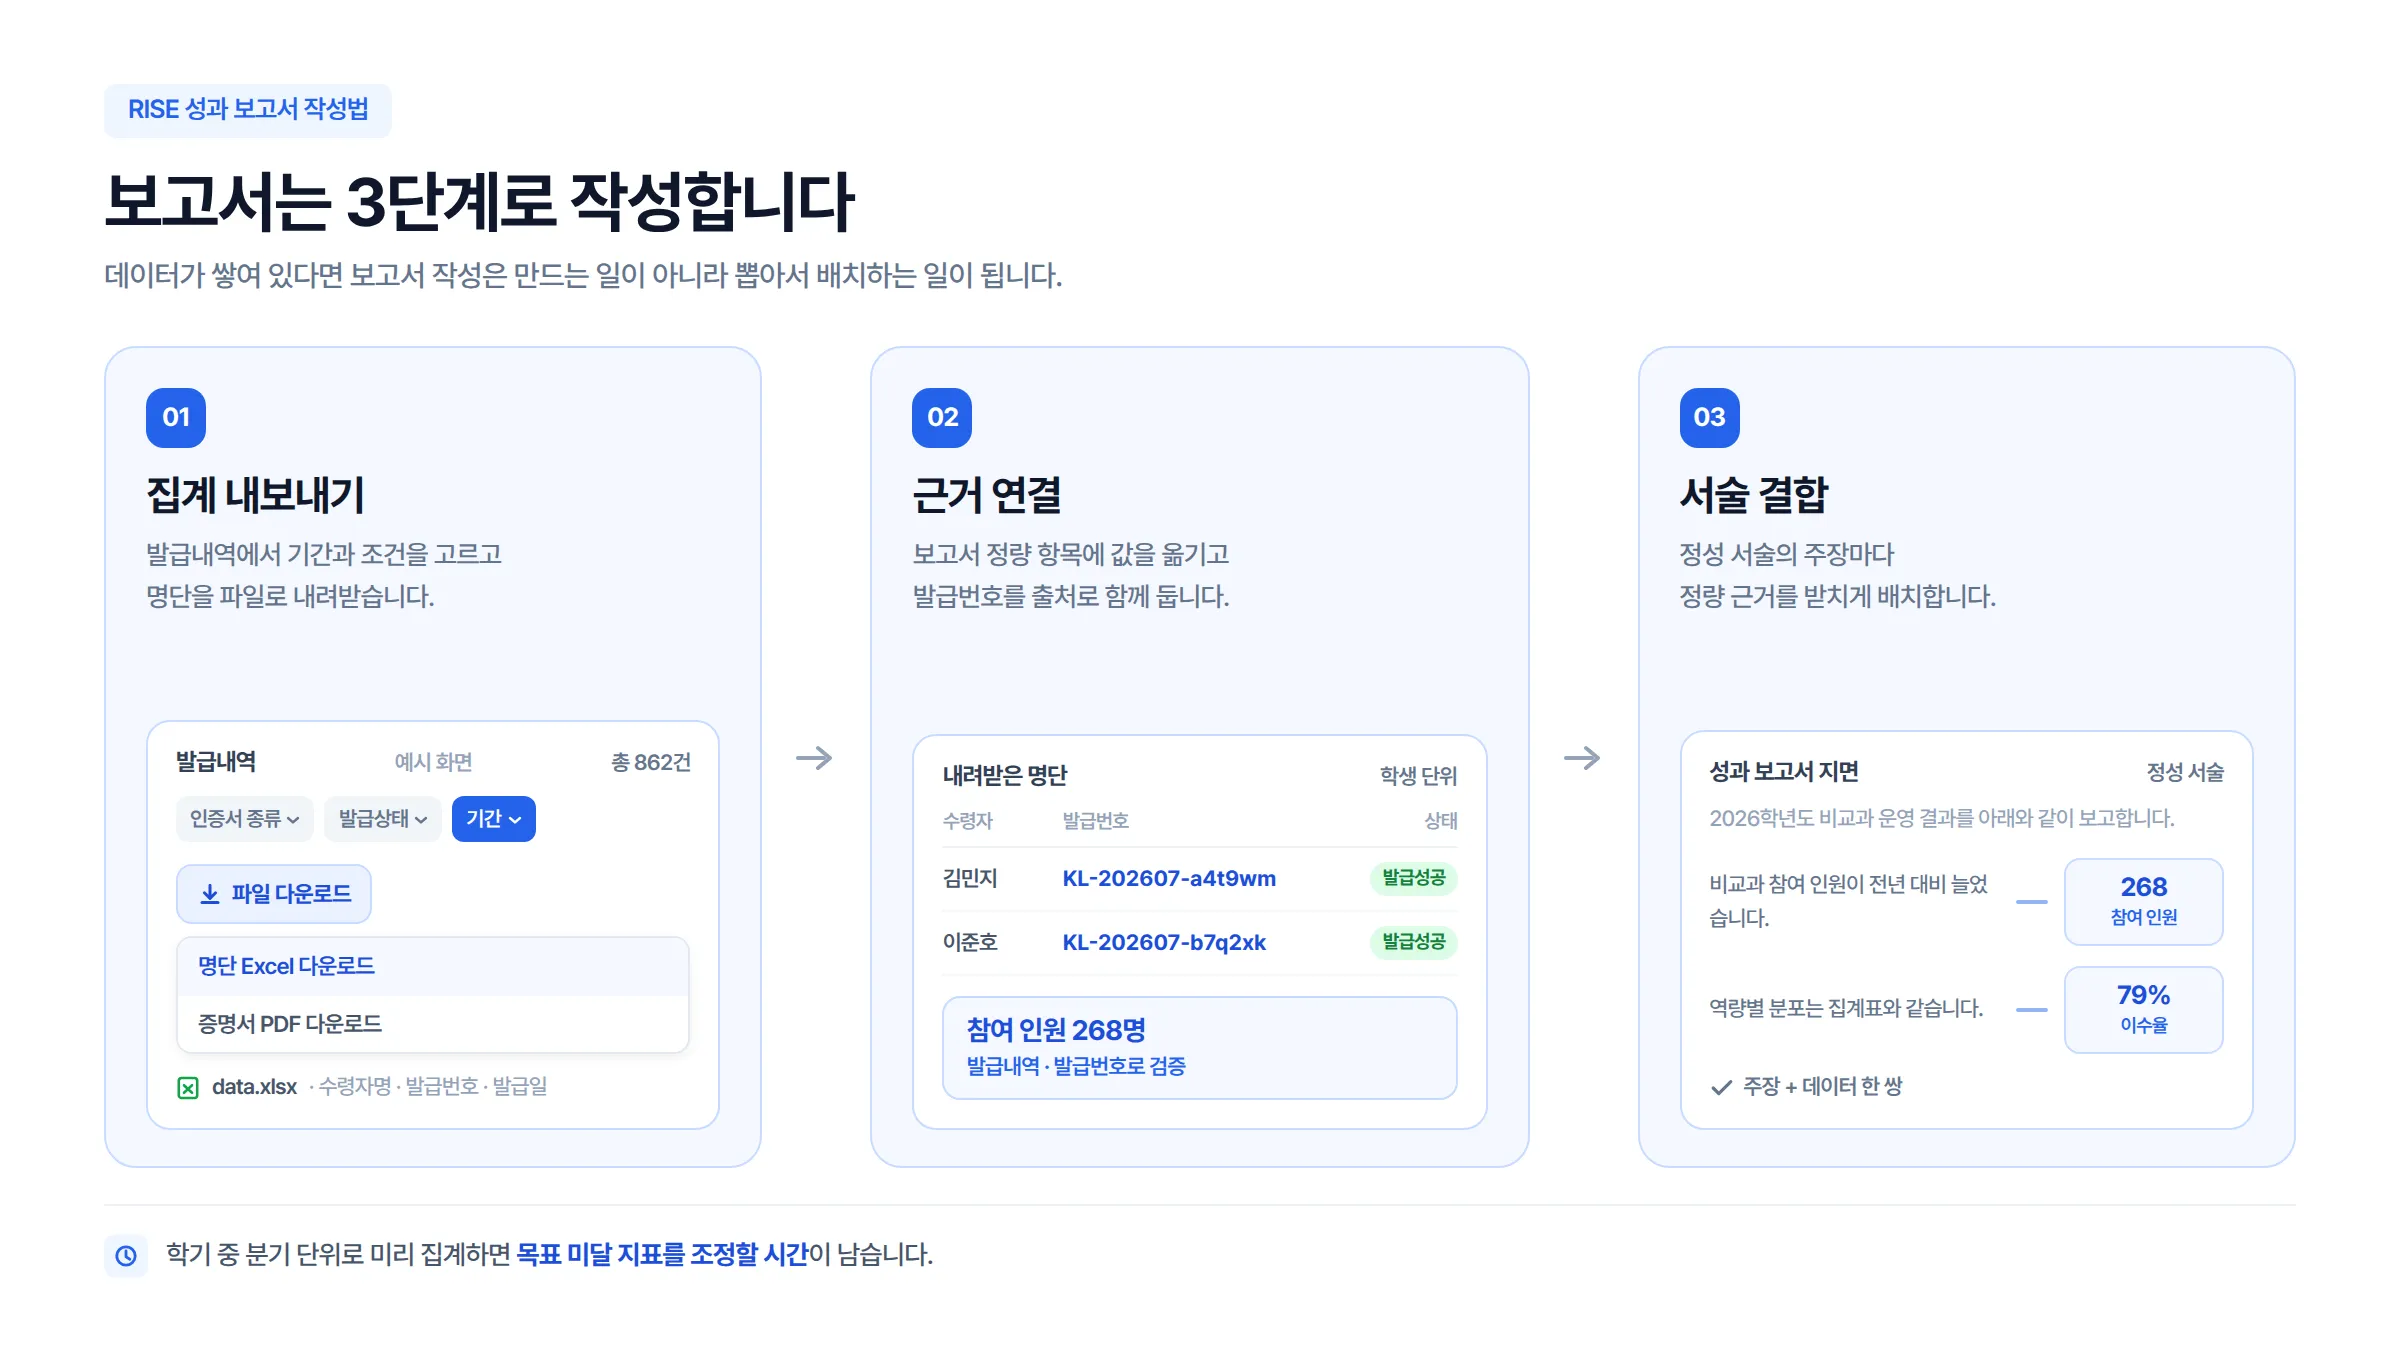
Writing proceeds in three steps: exporting the aggregation, linking the evidence, and combining the narrative. If the data is already accumulated, writing the report becomes not a matter of creating but of pulling and placing.
If you check the aggregation in advance quarterly during the semester, you can prevent discovering a metric that has fallen short of its target at year-end. The time to adjust is during the semester, not during the report-writing period.
How Do You Combine Qualitative Narrative with Quantitative Evidence?
Just because the qualitative portion is weighted at 60% does not mean filling it with narrative alone; that is actually a disadvantage. The narrative that carries weight in evaluation is the narrative that data supports. Instead of “student participation was active,” write “extracurricular participation increased year over year, and the distribution by competency matches the aggregate table,” and the qualitative narrative itself becomes a commentary on the quantitative evidence.
Being able to explain authenticity also raises the credibility of the narrative. Because badges carry the issuing body and achievement criteria in the certification under the 1EdTech Open Badges 3.0 standard (Final, 2024), even if you are asked for the source of the evidence during evaluation, you can show it immediately via a verification link. The University of Seoul Industry-Academic Cooperation Foundation case is an example of connecting industry-academic outcomes all the way to reporting through this flow.
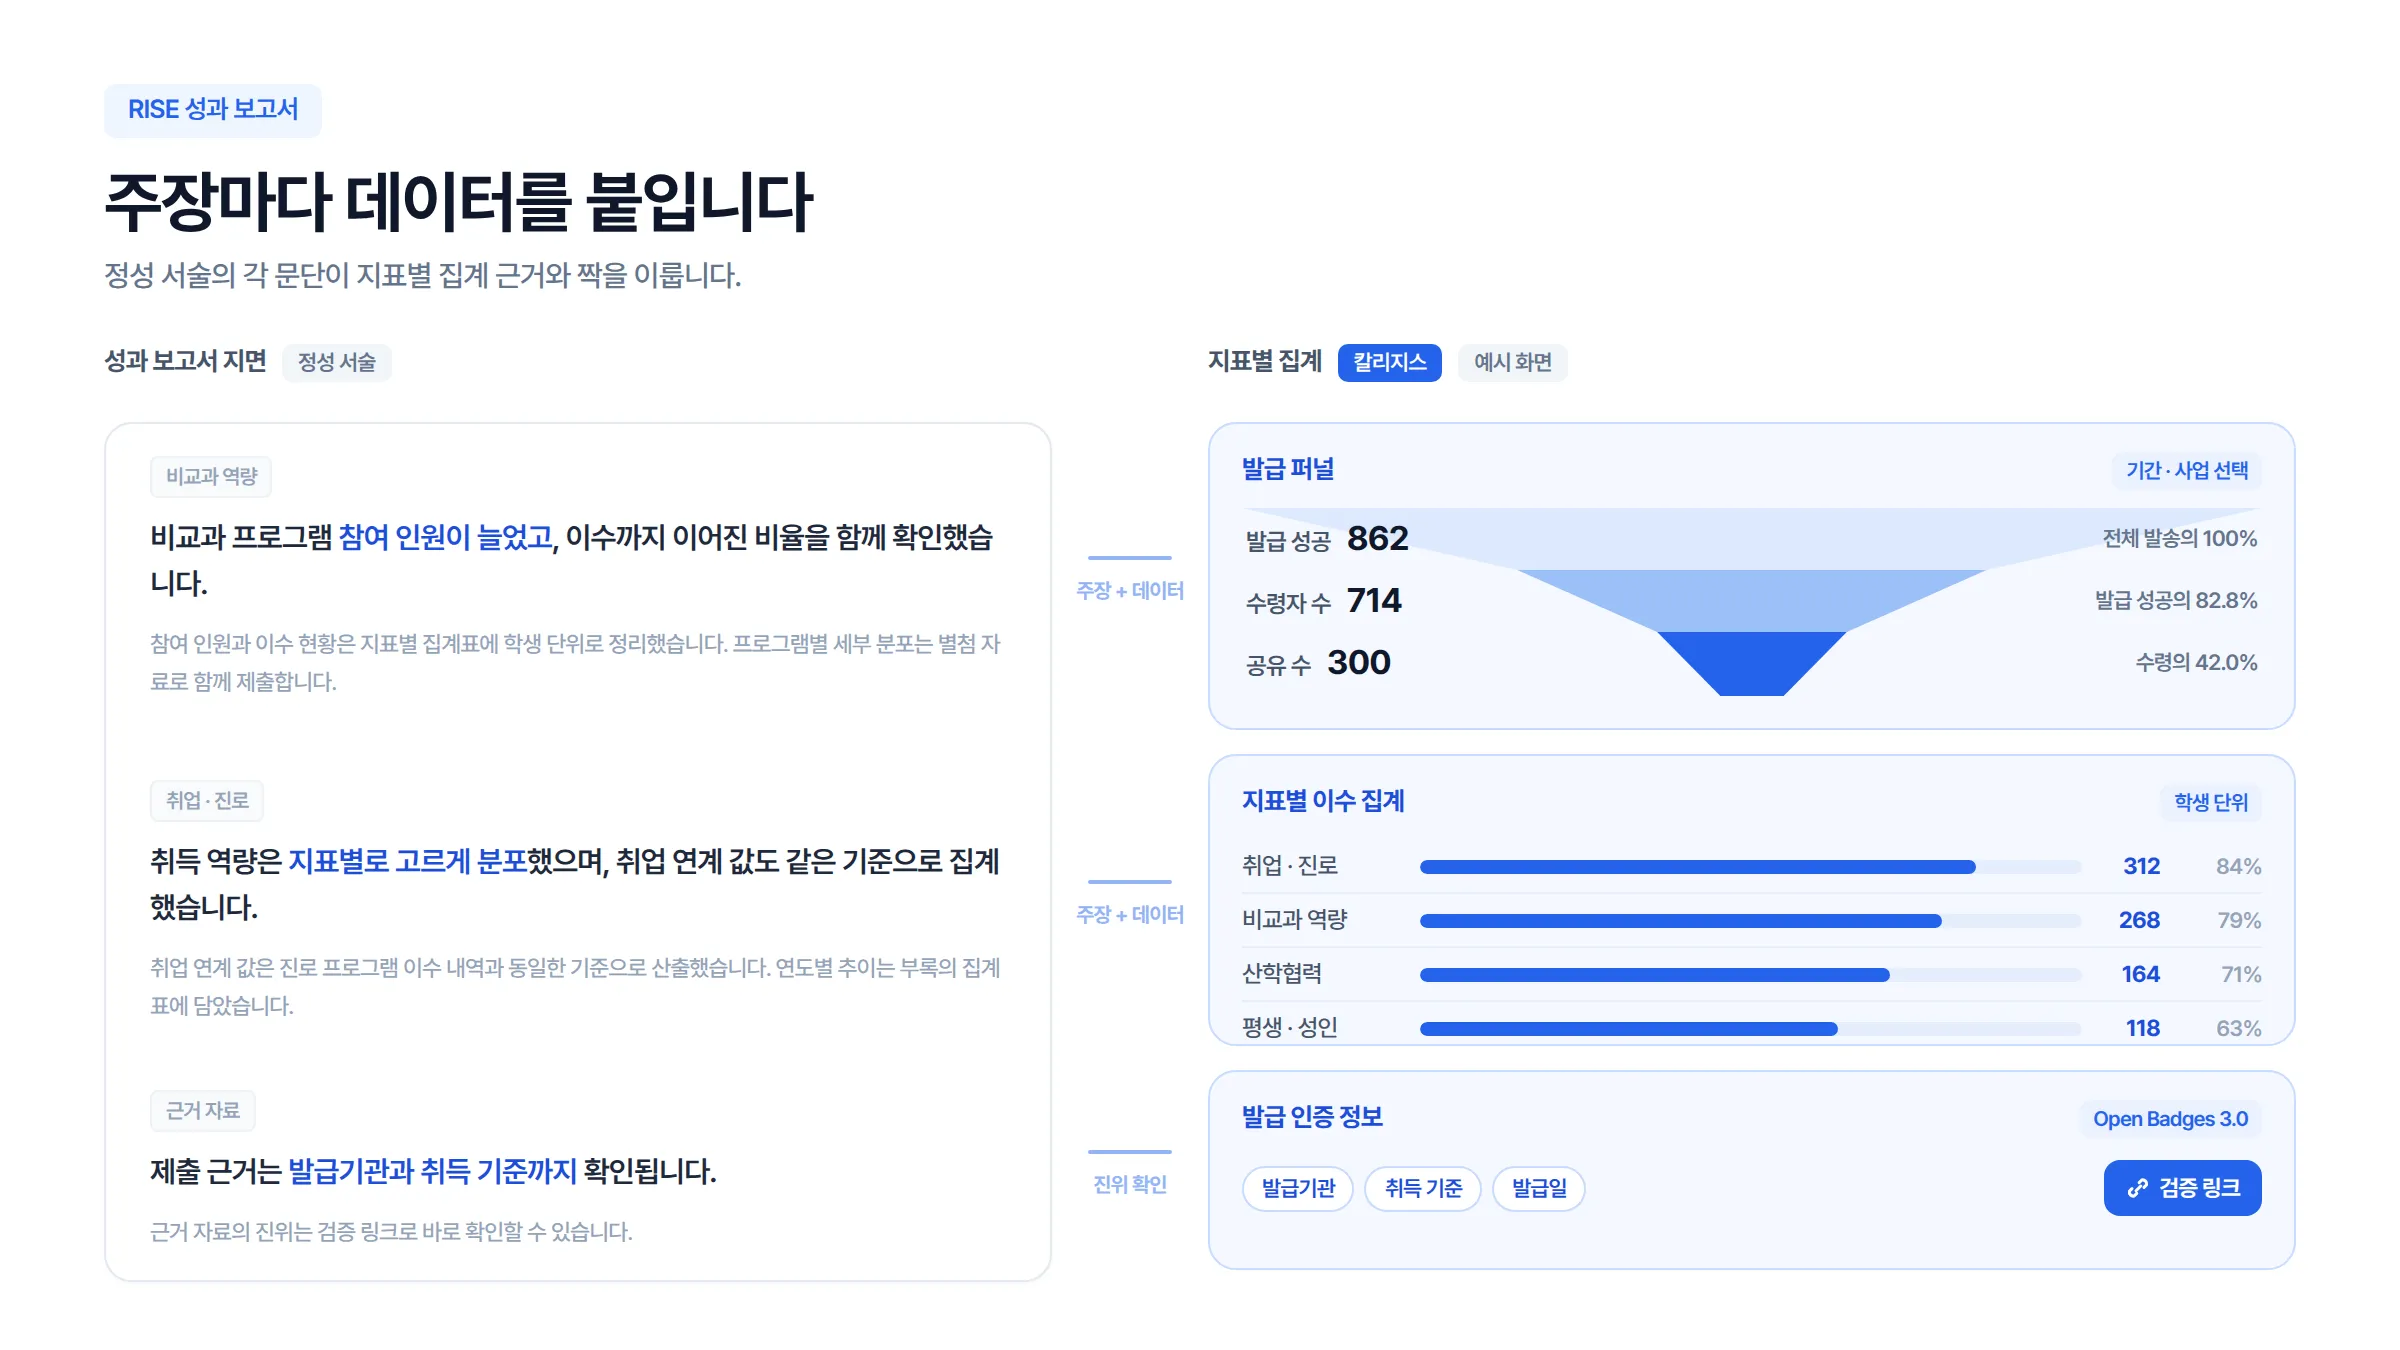
The report is rewritten every year, but the evidence does not have to be gathered anew every year. Kolleges handles everything from aggregating issuance data by metric to exporting reporting deliverables on a single infrastructure. If you are preparing this year’s report, check the metric-by-metric aggregation screen in the demo.
Frequently asked questions
Want to turn learning outcomes into verifiable assets?
From issuing to verifying and amplifying, see it for yourself with Kolleges.
Request a Kolleges demoRelated posts

2026 RISE·Anchor Performance Evaluation: 3 Steps to Prove University Outcomes with Data
As RISE becomes Anchor, budgets are divided by performance evaluation. Here is how to prove scattered university outcomes with the 3-tier digital badge structure and co-issuance, with cases.

RISE Performance Metrics: 4 Steps to Prove Them with Metric-by-Metric Badge Mapping
The 4-step practice of mapping the 6 core RISE performance metrics to metric-specific badges, organized in comparison with qualitative reports.

How to Connect RISE Performance with a Three-Tier Digital Badge Structure: A University of Seoul Case
The University of Seoul's RISE project team bundled the outcomes of 7 programs across 3 areas (industry-academia cooperation, AI, and convergence regional innovation) into 15 digital badges. This is the design behind a three-tier structure connecting unit badges through pathways to a comprehensive certification, turning scattered university achievements into verifiable one-line credentials.